入力は論文の題名、URL か適当なキーワードにして、出力は関連する論文をグラフにまとめたものの予定。
作りかけなのはGoogle Scholarのボット検出に引っかかってしまうからです。今は引っかからないように毎回のアクセスに10~20秒時間をおいていますが、そうするとあまり大きな検索をすることが出来ません。大きな検索が出来ないとなると面白い結果が出せないので、ボット検出を避ける(なるべく穏便な)方法を探しています。(仮想IPアドレスを使って避けるという横暴(?)な方法もあるのですが、最終的にGoogle App Engineなどで公開したいので...正攻法はないものでしょうか。)
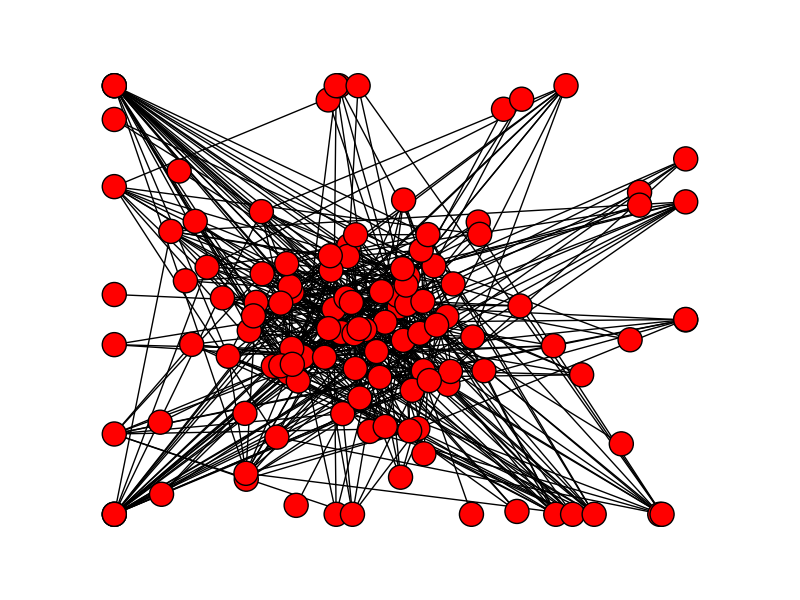
という訳で今のところcomputerに関連した論文を検索しているだけなので特に有用なスクリプトにはなっておりませんが、今のところの出力はこんな感じです。
キーワード「Computer」に関連した論文の関係を図示。ボット検出をくぐれたらGUIも整備することにします。
BeautifulSoup, networkxとmatplotlibをダウンロードする必要があります。
1 2 3 4 5 6 7 8 9 10 11 12 13 14 15 16 17 18 19 20 21 22 23 24 25 26 27 28 29 30 31 32 33 34 35 36 37 38 39 40 41 42 43 44 45 46 47 48 49 50 51 52 53 54 55 56 57 58 59 60 61 62 63 64 65 66 67 68 69 70 71 72 73 74 75 76 77 78 79 80 81 82 83 84 85 86 87 88 89 90 91 92 93 94 95 96 97 98 99 100 101 102 103 104 105 106 107 108 109 110 111 112 113 114 115 116 117 118 119 120 121 122 123 124 125 | # Parser from bs4 import BeautifulSoup import urllib2 # Network and Visualizing import networkx as nx import matplotlib.pyplot as plt # For polite bot import time import random import datetime url = "http://scholar.google.com" class CitationGraph: def __init__(self, title=''): self.g = nx.Graph() def add_result(self, result): self.g.add_node(result.title) for paper in result.papers: self.g.add_node(paper.title, paper = paper) self.g.add_edge(result.title, paper.title) def draw(self, path): nx.draw(self.g) plt.savefig(path + ".png") """ def extract(self, least_citations): if node['citations'] < least_citations: self.g.remove(node) """ """ The information of papers gain from specific URL. It also contains information about the context of the results. (ex. Cited or Related to the paper or a word search result) """ class Result: def __init__(self, query, title='', depth=1): self.title = title if 'cited' in query: context = 'cited' elif 'related' in query: context = 'related' else: context = 'search' self.query = query self.papers = [] self.search(1) def search(self, depth=1): time.sleep(random.randint(10, 20)) data = opener.open(url + self.query).read() soup = BeautifulSoup(data) for paper in soup.find_all('div', {'class' : 'gs_r'}): title = paper.find('div', {'class' : 'gs_ri'}).find('a').get_text() author = paper.find('div', {'class' : 'gs_a'}).get_text() abst = paper.find('div', {'class' : 'gs_rs'}).get_text() for link in paper.find_all('a'): if 'Cited' in link.get_text(): cited_link = link.get('href') citations = int(link.get_text().strip('Cited by ')) p = Paper(title, author, abst, cited_link, citations) self.papers.append(p) def print_papers(self): for paper in self.papers: paper.print_data() class Paper: def __init__(self, title, author, abst, cited_link, citations=0): self.title = title self.author = author self.abst = abst self.cited_link = cited_link self.citations = citations def print_data(self): print(self.title) print(self.author) print(self.abst) print(self.citations) print(self.cited_link) print('\n') """ Main Function """ opener = urllib2.build_opener() opener.addheaders = [('User-agent', 'Mozilla/5.0')] query = "/scholar?hl=en&q=computer&btnG=&as_sdt=1%2C5&as_sdtp=" r = Result(query, 'computer') r.print_papers() c = CitationGraph() c.add_result(r) for paper in r.papers: r2 = Result(paper.cited_link, paper.title) r2.print_papers() c.add_result(r2) t = datetime.datetime.now().strftime("%Y-%m-%d %H:%M:%S") c.draw('whole' + t) plt.show() |
0 件のコメント:
コメントを投稿